Leakage/Evaporation and Gas Dispersion Simulation
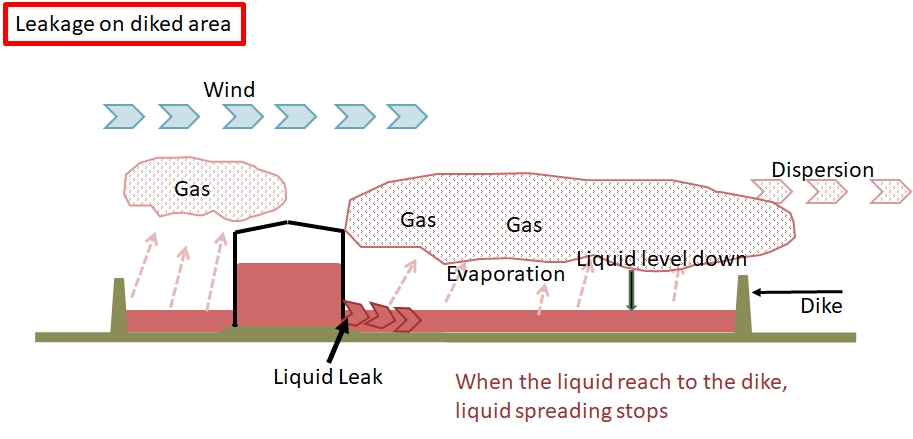
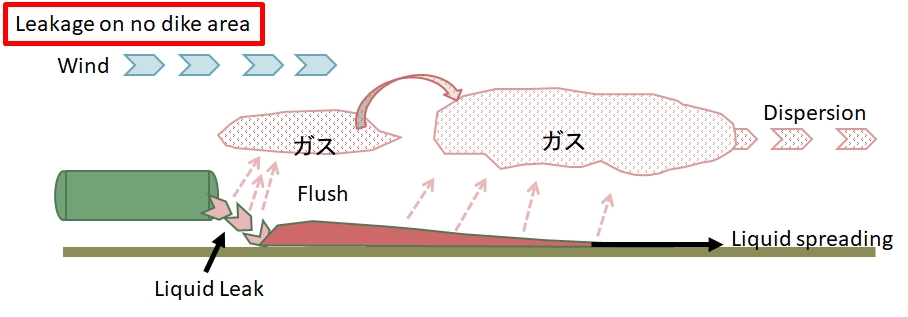
FPEC had developed the simulation PC programs for calculation of accidental leakage rate, liquid spreading and evaporation rate of hazardous liquid. As illustrated below, while hazardous liquid leaks, some portion of the leakage is flashed and the remaining liquid is spreading over the ground , evaporating, and dispersing. These phenomena occur simultaneously in parallel. This program calculates exhaust rate change of the gas with the passage time and to pass them to the dispersion calculation program. By calculations for changes of these phenomena with the passage time from the initiation of the leakage, gas dispersion maps are prepared along to the passage time to confirm how to progress the gas dispersion.
|
|
 |
Leak・Evaporation
Leak Calculation
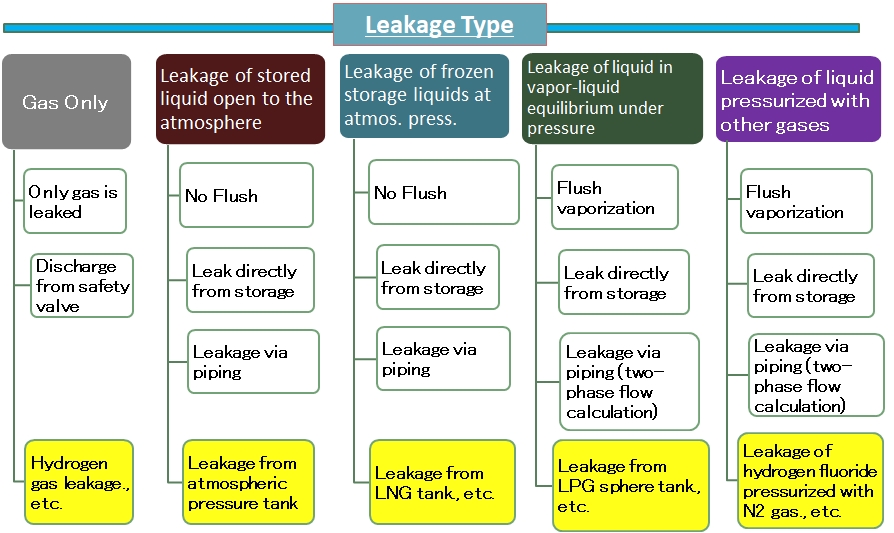
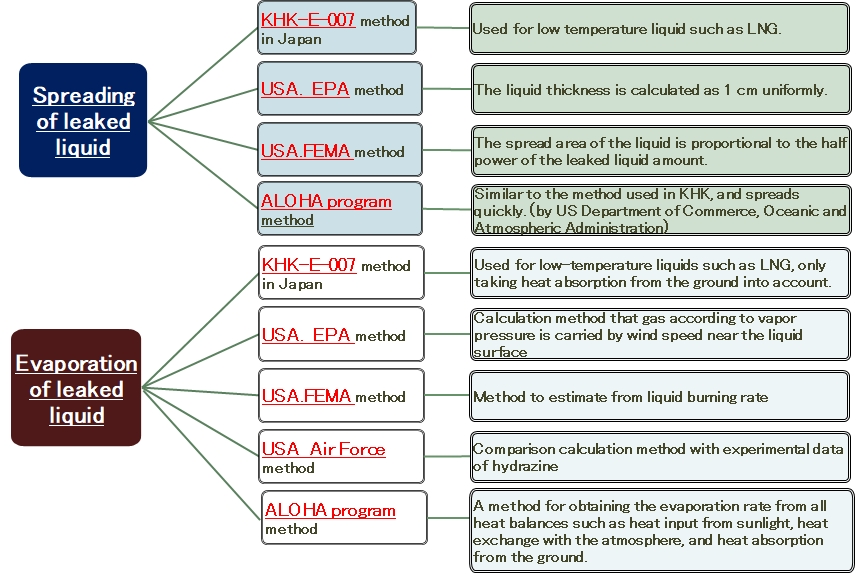
In general, Leakage of hazardous materials in refineries and chemical plants falls into one of the types in the figure below. Our program can calculate any type of the leakage.
Liquid Spreading and Evaporation Calculation
Various calculation methods are presented for liquid spreading on the floor and evaporation rate from it. FPEC's program can calculate in every method shown in the figure below. On the liquid spreading, USA-FEMA method is recommended. On the evaporation rate, ALOHA method is recommended, which method is calculating every heat balance around the liquid pool and to require many data, such as atmospheric stability, day and time, lat/long, wind speed, heat conductivity of the floor, etc.,
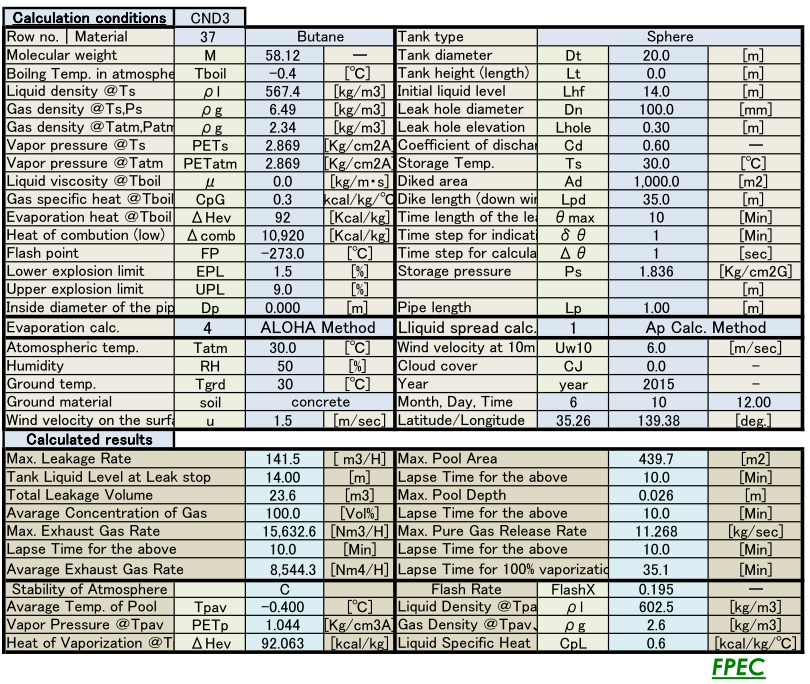
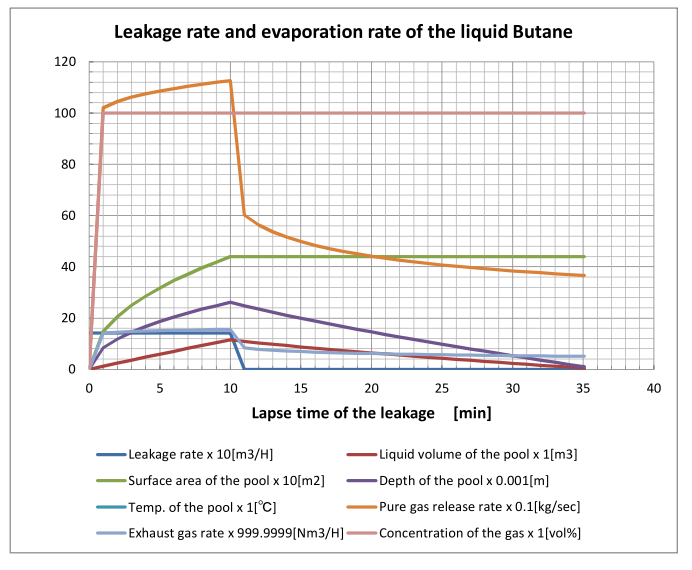
Calculation Sample
Case; Liquid butane leaks from the spherical tank for 10 minutes and accumulated in the dike
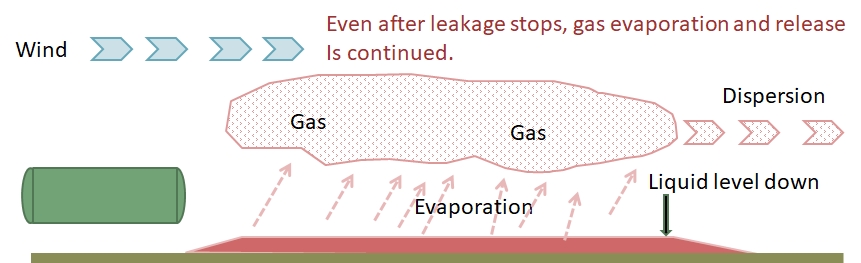
During the leakage for 10 minutes, pure gas release rate is sum of the flashing and the evaporating, but after stopping the leakage, it is evaporation rate only and continue to zero thickness of the liquid pool.
 |
 |
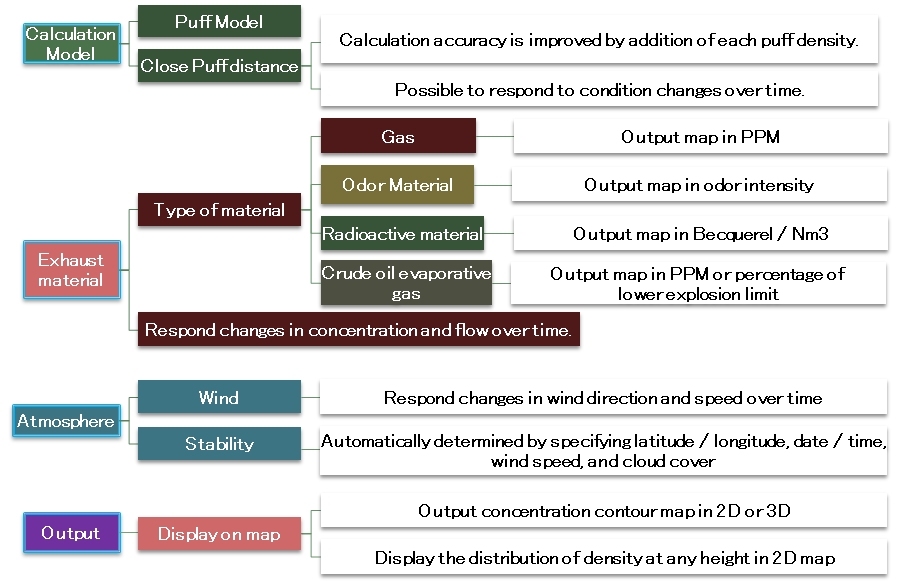
Gas Dispersion Simulation
FPEC's simulation program is of puff model, which is proven method for atmospheric dispersion assessment. The intervals between puffs is as close as possible, and the calculation accuracy is increased by adding the concentration from each puff. The program also supports change in weather conditions, exhaust gas volume and its concentration.
Results of concentration distribution are displayed by 3D, 2D graphics to make the gas dispersion map. Observation locations can be set on the map and concentration change with time at this point can be indicated on a graph.
Capabilities of this program are summarized in the figure below.
Dispersion map with % of LEL is available for not only crude oil but also other pure or mixed gas.
Sample of Gas Dispersion Simulation
Case; Liquid butane leaks from the spherical tank for 10 minutes and accumulated in the dike
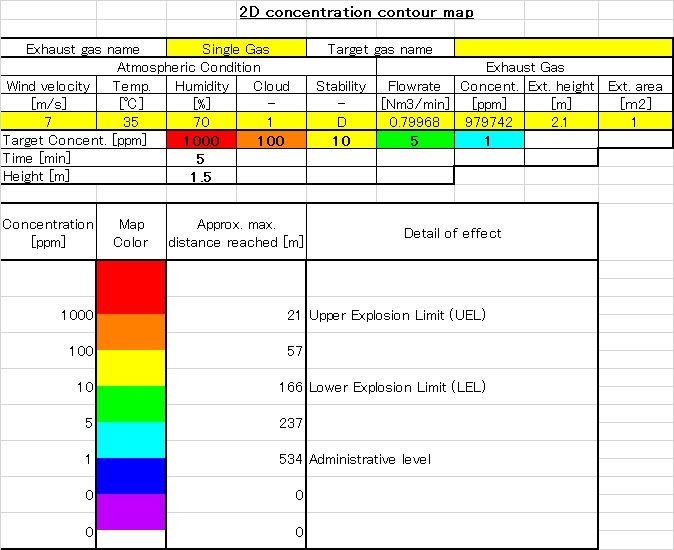
Calculation results obtained in the above sample is input as an exhaust gas rate and dispersion maps and table shown below are output .
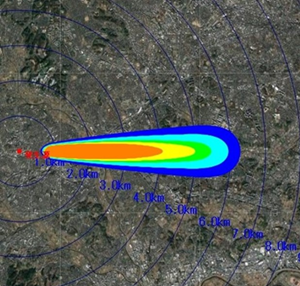
| 2D gas dispersion map. Any elevation of the concentration indicated can be selected. |
Max. distance from the exhaust point to the specified concentration are summarized in the table, such as LEL, dangerous concentration for human body etc,. |
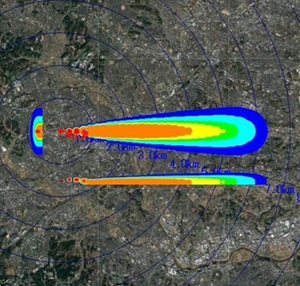
3D gas dispersion map. The left figure means the view of the concentration distribution from the right side, and the below figure means the view from under side. |
 |
 |
 |