Heat Radiation (Tank Fire and Spill Fire)
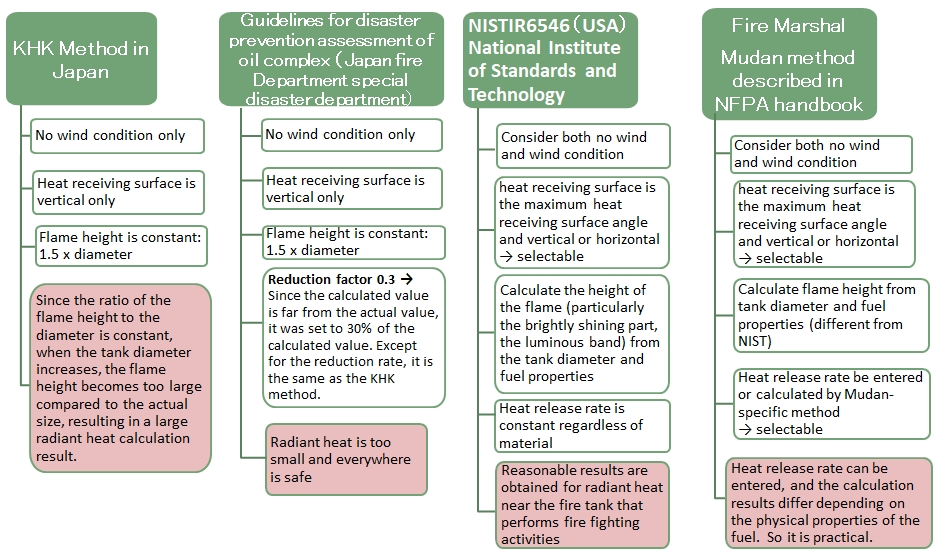
FPEC had developed the heat radiation simulation program, which calculates heat flux from a tank fire or spill fire and prepares 2D, or 3D contour map of the heat flux. This program is to calculate heat flux by Mudan's method described in NFPA Handbook. In addition to Mudan's method, other calculation methods are also included in this program as shown in the figure below. The emissive power used for the calculation is average value over the flame height in other than NIST6546, but actually, the lower part of the flame is burning red to emit stronger heat than the higher portion. NIST6546 call the lower portion as luminous band, and indicates its emissive power is to be 100 [kw/m2] regardless of burning fuel. When considering safety for fire fighters, who may be positioned near the fire, luminous band seems reasonable and reflecting actual situation, while average emissive power is suitable for heat flux at long distance from the fire.
|
Experience the simulation
|
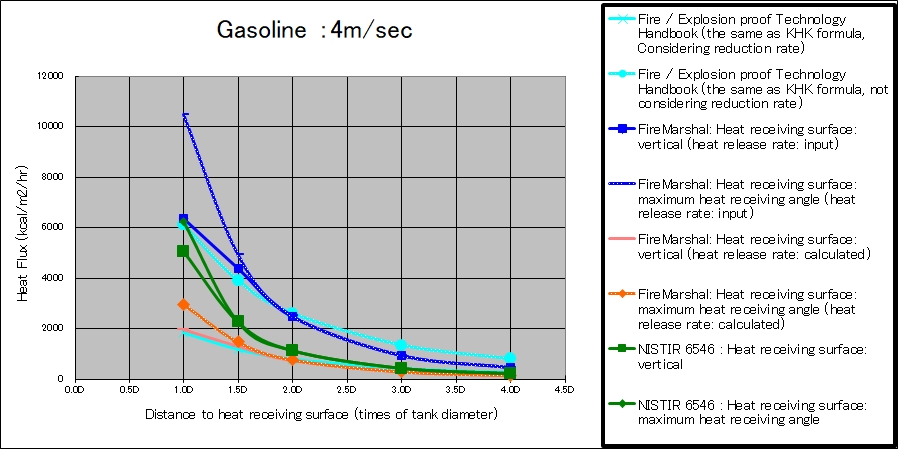
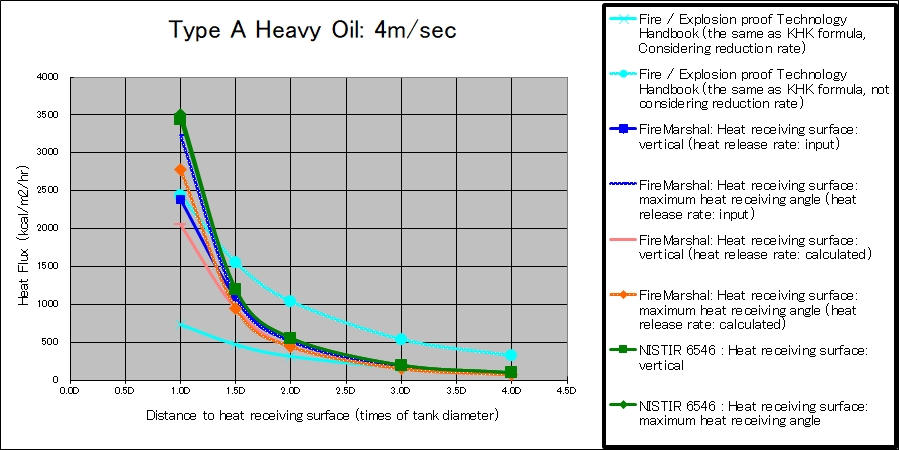
The figures below are calculation results by various methods in case of a full surface fire of gasoline, or A-type heavy oil in the tank of 80 m in diameter.
Horizontal axis shows distance from the tank center in multiples of tank diameter.
|
(Tank diameter: 80m, Tank Height: 22m, Gasoline (50,000kcal/m2/hr), Wind speed 4m/sec) |
(Tank diameter: 80m, Tank Height: 22m, Type A Heavy Oil (20,000kcal/m2/hr), Wind speed 4m/sec) |
Simulation Sample
Tank Fire
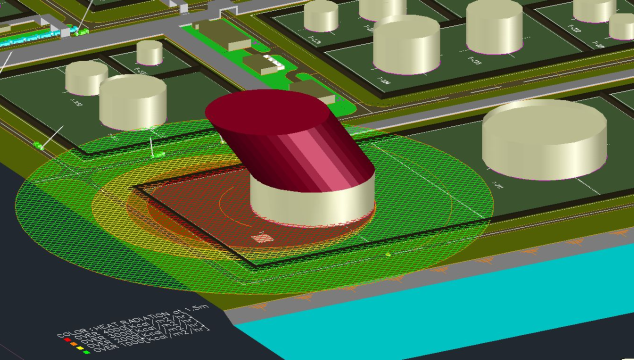
Case; Crude oil tank fire (diameter 72 m)
The heat receiving surface is ones of maximum heat receiving angle in this sample, though heat flux on horizontal or vertical surface can also be calculated.
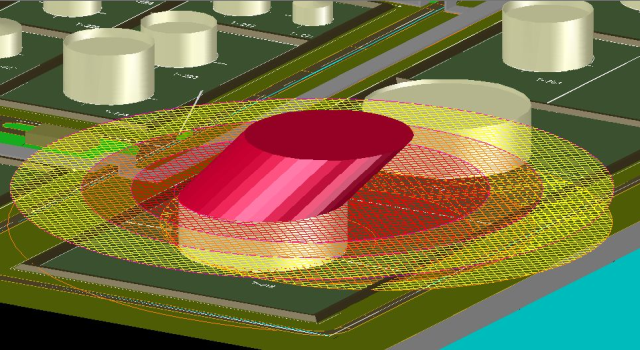
The right picture shows heat flux contour map on two elevation level. Either unit of heat flux, [kcal/m2/h」or「kw/m2] , can be output.
|
Heat Flux at elevation height of 1.5 m from the ground |
Heat Flux at elevation height of 1.5 m and 22 m (tank height) from the ground |
Spill Fire in Process Area
Case; Spill fire in process plant area
The figure below is the case that diesel oil pool is made in size of 10 m x 10 m on the concrete floor and fired under windy condition.
Spill pool can be located at any position and any size, and any elevation height of a heat receiving surface can be selected so that necessity of water cooling can be confirmed.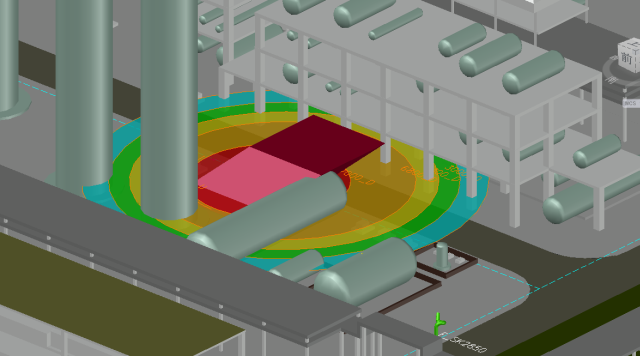
3D Heat Flux Map
Our program has a capability that heat flux level is displayed with 3D contour map, like concentric circles.
The picture below is the case of a tank fire under wind condition. It is easily found that the downwind heat flux is larger than the upwind on the ground, but at the elevated level, the upwind heat flux is larger than the downwind.
This is one of the reason a tank fire is usually spreading toward the adjacent tank located in upwind direction, since upper portion of the upwind side tank is heated up to release flammable gases, which flow toward the fire and ignited. Therefore, necessity of cooling of upwind side tank must always be considered.
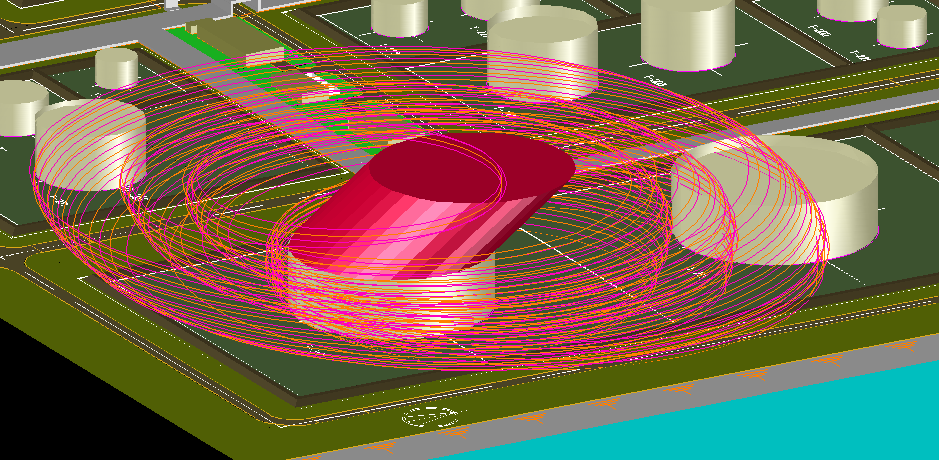
The picture below is view from right beside.